INTRODUCTION
Here we look at five of the best squads to win a Championship. Not necessarily the five best ever but five of the best teams that showed dominance during their run to the title. We will mostly focus on their regular season play with a look also at the playoff runs.
The five teams have been plucked from different eras. This isn’t a comparison of eras but the story of what each team faced to get their championship and how they did it. We will look at records and statistical output and try to provide some context.
Roles, systems, and style of basketball is constantly changing. Change is often a result of rule changes or a trend based on teams following whoever the most recent successful team is.
There are a lot of preconceptions around differing eras, some correct but some don’t hold up under the microscope. The teams we are looking at did as well as most, in their respective era and under their particular conditions. Most of them were multiple time champions.
THE CHAMPIONS
VPM DATA
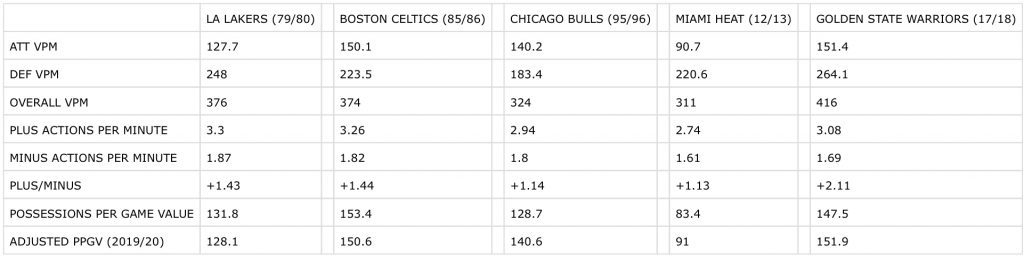
One thing to keep in mind, is pace. Teams will have more possessions per minute which will in turn, affect their value per minute, as well as, their possessions per game value. Only the Lakers and Warriors played at a faster pace than the league average. The Lakers had the most possessions of the five teams, with the Heat having the fewest.
Although we have weighted all the stats by 2019/20 standards, we haven’t taken into account pace with the VPM. However, with the Points Per Game Value we can see the total value of a team’s and player’s possessions, with the adjusted PPGV, showing it adjusted to today’s pace.
The Golden State Warriors own the highest per minute value for both attack and defense, and therefore overall. This is down to two main reasons, the high rate of three point shooting and a commitment to the old school values of defense.
The Lakers had the most positive actions per minute, with the Heat having the fewest negative actions per minute. Overall, the Warriors had the best plus/minus actions.
As for the total value created by their possessions, the Celtics came out on top in that regard. They not only had a high pace, but also a high conversion rate coupled with a high number of offensive boards.
Miami Heat had the lowest attacking VPM and the Bulls the lowest defensive VPM. Overall, the Heat had the lowest VPM. It’s not surprising given these two teams played at the slowest pace. Chicago played in the most defensive era of the modern NBA. They had some of the best defensive players ever in their positions, but thanks to their dominance in the offensive end and the slow pace, they didn’t have as many defensive plays as the other teams.
Miami also had the fewest positive actions per minute and the Lakers had the most negative actions. The Heat had the lowest plus/minus. This is also where pace has played a big part.
As for the PPGV, Miami also had the lowest. Once again, pace being a big reason for this.
TRADITIONAL STATS
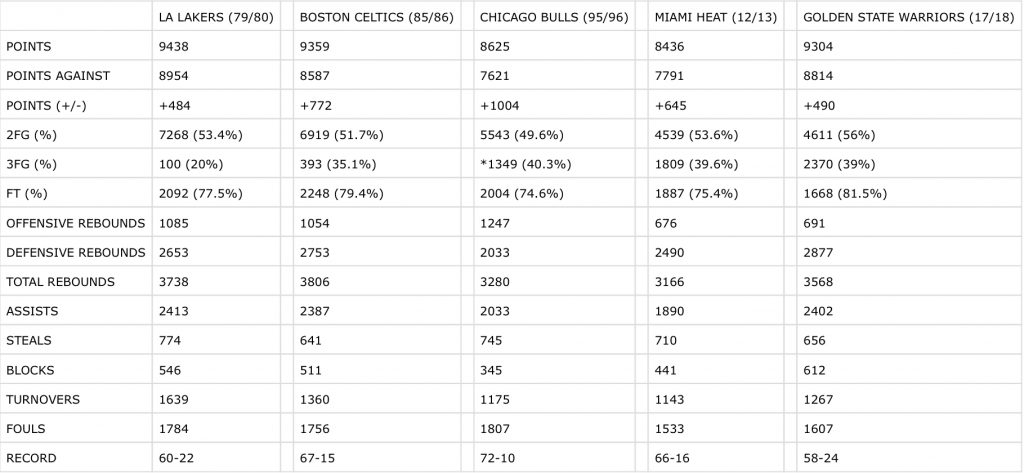
The Lakers played at the fastest pace of all the teams, enjoying 238 more possessions than the next closest, Boston Celtics. As a result, it’s no surprise that they scored the most points.
The Warriors had the best 2FG% and the Bulls had the best 3FG%. In 1995/96, the NBA had a shortened 3pt line. Although at the corners, it was always 22 feet (6.7m), the top of the key (23.75 feet/7.24m) was brought in by 1.75 feet (54cm). With the normal 3pt line, the Heat had the highest percentage.
It is interesting to note that, from the corner where the 3pt line has always been 22 feet (6.7m), the Bulls shot 41.5% compared to the Heat’s 36.5% and Warriors’ 40.9%. This is despite many more attempts by both the Heat and Warriors.
It also should be noted, the 3pt line was only adopted by the NBA in the 1979/80 season. It is therefore understandable to see why the Lakers only attempted 100 shots for the season. The three point shot as a key offensive strategy was a long way off where we are today. As volume of shots rose, so did the percentages.
Chicago had the least points scored against them and the biggest point differential between themselves and their opponents. LA had the closest point differential to their opponents.
Chicago had the most offensive boards and the Warriors the most defensive boards. The Celtics had the most overall rebounds.
The Lakers had the most assists to go with their most points. Hardly surprising with two all-time great point guards facilitating to one of the most unstoppable offensive players in history.
The Lakers also had the most steals and the most turnovers. Pace again contributing to the statistical output.
What might be surprising to many is that Golden State had the most blocks. The 2017/18 season had one of the lowest blocks per game average for teams since they’ve been recorded, at just 4.8 per game. League averages in 1979/80 and 1985/86 were 5.3 blocks per game, and 5.1 for 1995/96 and 2012/13. There is a plausible explanation.
The NBA, in large part thanks to the Warriors, had adopted the three point shot like no other time in NBA history. In 2017/18, the 3pt shot had become the single most attempted shot range in the game at 33.7%. However, the second most attempted shot range was 0-3 feet at 28.1% for an average success rate of 65.8%. These two shots accounted for 61.8% of the shots in an average NBA game.
Golden State did an excellent job of seeing this trend and doing something about it. Their answer was to rotate minutes between five centers, all who except for Zaza Pachulia, had much higher defensive values than attacking. This coupled with starters, Kevin Durant and Draymond Green, gave them rim protectors who contributed 1.4 more blocks than the next closest team and 2.7 more blocks than the league average.
If we look at 1995/96, three of the top 5 leading scorers were centers. Five centers were in the top 10 and three power forwards. Only Jordan (1st) and Mitch Richmond (8th) were guards in the top 10.
By 2012/13, Brooke Lopez was the only center in the top 10 (10th), there were 6 guards and small forwards and the two of the three power forwards listed were, Carmelo Anthony and LeBron James.
In 2017/18, only one center was in the top 10 (LaMarcus Aldridge, 9th). Five guards, one small forward (Durant), and three power forwards (James, Anthony Davis and Giannis Antetokounmpo) made up the rest of the 10. So we can see as the big men started to be less offensively dominant, it was the guards and wings doing the bulk of the scoring. With the spacing available due to the zone and stretch basketball, driving had become easier, but the Warriors had other ideas.
THE FINAL HURDLE
Winning titles is the ultimate aim of the game so let’s look at the final hurdles for these great teams.
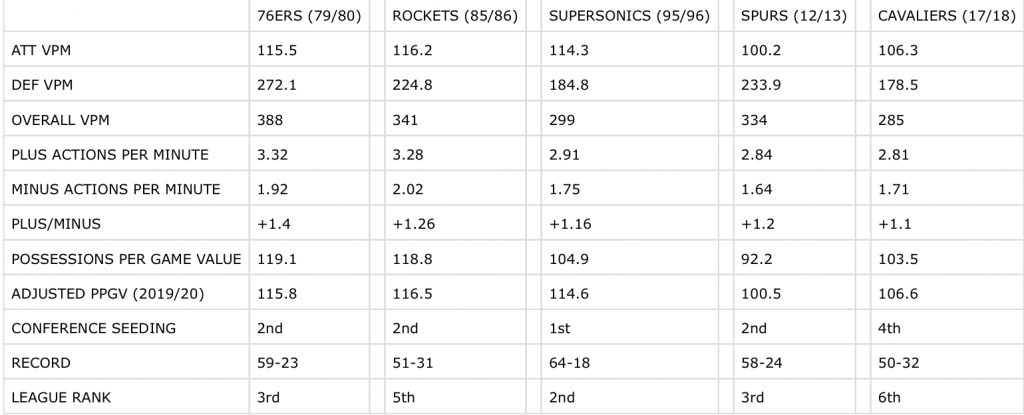
Of the Finals opponents, the Houston Rockets had the highest attacking VPM and the Philadelphia 76ers had the highest defensive VPM. Overall, the 76ers had the highest combined VPM.
Philadelphia also had the most positive actions per minute while the San Antonio Spurs had the least negative actions. The 76ers took out the overall plus/minus.
As for the PPGV, the Sixers also had the highest value for their total possessions, although when adjusted to today’s pace, the Rockets had the highest PPGV.
Seattle were the only opposition who were the number one seeds in their conference. They were also the highest ranked opponent in the league with the best record of the opponents, 64-18. This would suggest that the Bulls were the only team to play and beat the clear second best side in the league.
How about the road to the Finals? Let’s look at each run by our teams before the Finals.
First, the Lakers only had to play two rounds before the Finals. In the first round they played the 55-27 Phoenix Suns, a team with one less win than them. They won that series 4-1. They then played the 56-26 Supersonics and won that 4-1. The 76ers (59-23) gave them their biggest test of their opponents. On average their opposition had 57 wins and their playoff record was 12-4.
Next we have Boston. They swept the 30-52 Bulls in the first round, a team they had a 37 win better record than. Next they played, Atalanta who were 50-32. They won that series 4-1. They swept the 57-25 Milwaukee Bucks in the Eastern Conference Finals before beating Houston, 4-2. The Bucks had the best record but the Rockets provided the greater test. The Celtics went 15-3 against an average of 47 win teams, although that’s brought down a lot by the Bulls.
Chicago swept the 42-40 Miami Heat in the first round. Beat the 47-35 New York Knicks, 4-1. They then faced the 60-win Orlando Magic in the Eastern Conference and swept them 4-0. Finally, they beat the 64-win SuperSonics, 4-2. They had a 15-3 record. The were the only side to face two 60-plus win teams in their run. Their opponents had an average of 53 wins.
By 2012/13, the NBA had made the first round a best-of-seven series. Miami Heat swept the 38-44 Bucks, 4-0 in the first round. They then met the 45-37 Bulls who they beat 4-1. They faced the 49-32 Indiana Pacers in the Conference Finals and beat them 4-3, including one overtime victory. Another tough series awaited against the 58-24 Spurs. They came through that 4-3 with another OT victory in the mix. They finished 16-7 against teams with an average of 48 wins.
Golden State’s record belies their real strength with Curry, Durant, Thompson and Green all missing a significant amount of games during the season. They faced the 47-35 Spurs in the first round and won that 4-1. They then played the 48-win New Orleans who they also beat 4-1. Next up were the 65-win Rockets who pushed them to seven games, 4-3. They then swept the 50-win Cavaliers. Their opponents averaged 53 wins and they finished with a 16-5 record.
The Lakers faced on average the strongest competition while the Warriors faced the opponent with the best record. The Bulls faced the most 60 win teams. Miami had the easiest run on paper with no teams with 50 or more wins before the Finals but had the toughest time getting the chip.
The Warriors were also the only team who had an easier Finals win than a every other playoff series.
SQUADS
| Name | Position | Minutes Played | ATT VPM | DEF VPM | OVRL VPM | Action Rate (+/-) | Possession Per Game Value | Adjusted PPGV (2019/20 pace) |
|---|---|---|---|---|---|---|---|---|
| Norm Nixon | PG | 3226 | 18.2 | 23 | 41 | +0.21 | 15.4 | 14.9 |
| Kareem Abdul-Jabbar | C | 3143 | 33.5 | 118.5 | 152 | +0.53 | 27.6 | 26.8 |
| Jamal Wilkes | SF | 3111 | 32.7 | 34 | 67 | +0.25 | 26.6 | 25.9 |
| Magic Johnson | SG | 2795 | 41.6 | 59.5 | 101 | +0.43 | 32.4 | 31.6 |
| Jim Chones | C | 2394 | 11.4 | 39.7 | 51 | +0.19 | 7.1 | 7 |
| Michael Cooper | SG | 1973 | 24.6 | 29.9 | 54 | +0.16 | 12.7 | 12.4 |
| Spencer Haywood | PF | 1544 | 20.6 | 40.3 | 61 | +0.19 | 9 | 8.7 |
| Don Ford | SF | 580 | 16.4 | 21.1 | 38 | +0.11 | 4 | 3.8 |
| Averages | 2345 (28.6mpg) | 24.9 | 45.8 | 70.6 | +0.26 | 16.9 | 16.4 |
| Name | Position | Minutes Played | ATT VPM | DEF VPM | OVRL | WR (+/-) | Possession Per Game Value | Adjusted PPGV (2019/20 pace) |
|---|---|---|---|---|---|---|---|---|
| Larry Bird | SF | 3113 | 60.9 | 63.3 | 124 | +0.48 | 49.3 | 48.4 |
| Robert Parish | C | 2567 | 31.2 | 68.6 | 100 | +0.37 | 21.1 | 20.7 |
| Kevin McHale | PF | 2397 | 37.8 | 66.1 | 104 | +0.38 | 28.4 | 27.9 |
| Dennis Johnson | PG | 2732 | 22 | 30.4 | 52 | +0.21 | 16.4 | 16.1 |
| Danny Ainge | SG | 2407 | 34.4 | 18.5 | 53 | +0.22 | 22.1 | 21.6 |
| Bill Walton | C | 1546 | 26.2 | 88.1 | 114 | +0.4 | 10.8 | 10.6 |
| Jerry Sichting | PG | 1596 | 29.5 | 9.2 | 39 | +0.17 | 12.2 | 12 |
| Scot Wedman | SF | 1402 | 10.8 | 23.9 | 35 | +0.11 | 4.1 | 4 |
| Rick Carlisle | SG | 760 | 12 | 2.9 | 15 | +0.08 | 2.5 | 2.5 |
| Averages | 2058 (25.1mpg) | 29.4 | 41.2 | 70.7 | +0.27 | 18.5 | 18.2 |
| Name | Position | Minutes Played | ATT VPM | DEF VPM | OVRL | Action Rates (+/-) | Possessions Per Game Value | Adjusted PPGV (2019/20 pace) |
|---|---|---|---|---|---|---|---|---|
| Michael Jordan | SG | 3090 | 122.8 | 52.8 | 176 | +0.38 | 126.7 | 138.7 |
| Scottie Pippen | SF | 2825 | 74.2 | 49.9 | 124 | +0.27 | 86.9 | 95.1 |
| Toni Kukoć | SF | 2103 | 89.6 | 29.4 | 119 | +0.27 | 49.7 | 64.6 |
| Dennis Rodman | PF | 2088 | 75.4 | 41.7 | 117 | +4 | 72.9 | 79.7 |
| Steve Kerr | PG | 1919 | 74.1 | 14.5 | 89 | +0.15 | 39.8 | 43.5 |
| Luc Longley | C | 1641 | 53 | 45.5 | 99 | +0.15 | 50.1 | 54.8 |
| Ron Harper | PG | 1886 | 50.8 | 44.8 | 96 | +0.2 | 43.3 | 47.3 |
| Bill Wennington | C | 1065 | 60.5 | 5.3 | 66 | +0.07 | 18.9 | 20.7 |
| Jud Buechler | SF | 740 | 63.2 | 28.5 | 92 | +0.12 | 17.6 | 19.2 |
| Dickey Simpkins | PF | 685 | 35.1 | 11.8 | 47 | +0.14 | 10.2 | 11.2 |
| Randy Brown | PG | 671 | 21.5 | 50.3 | 72 | +0.1 | 13.6 | 14.9 |
| Jason Caffey | PF | 545 | 22.5 | 3.2 | 26 | +0.02 | 4.8 | 5.2 |
| Averages | 1605 (19.6mpg) | 61.9 | 31.5 | 93 | +0.19 | 44.5 | 49.6 |
| Name | Position | Minutes Played | ATT VPM | DEF VPM | OVRL | WR (+/-) | Possession Per Game Value | Adjusted PPGV (2019/20 pace) |
|---|---|---|---|---|---|---|---|---|
| LeBron James | PF | 2877 | 38.2 | 66.8 | 105 | +0.51 | 27.8 | 30.3 |
| Dwyane Wade | SG | 2391 | 11.1 | 57.8 | 69 | +0.32 | 7.4 | 8 |
| Chris Bosh | C | 2454 | 25.7 | 62.4 | 88 | +0.3 | 16.3 | 17.6 |
| Mario Chalmers | PG | 2068 | 15.4 | 29.6 | 45 | +0.12 | 7.9 | 8.7 |
| Ray Allen | SG | 2035 | 20.7 | 25.2 | 46 | +0.13 | 10.2 | 11.2 |
| Norris Cole | PG | 1590 | -8.4 | 14 | 6 | +0.03 | -3.2 | -3.5 |
| Shane Battier | SF | 1786 | 19.9 | 35.3 | 55 | +0.07 | 9.5 | 10.3 |
| Udonis Haslem | PF | 1414 | 25.4 | 25.8 | 51 | +0.21 | 9.2 | 10 |
| Mike Miller | SF | 900 | 24.4 | 24.3 | 49 | +0.17 | 7.1 | 7.8 |
| Rashard Lewis | PF | 792 | -5.4 | 32.3 | 27 | +0.07 | -1.5 | -1.6 |
| Chris Andersen | C | 624 | 24.6 | 78 | 103 | +0.3 | 7 | 7.7 |
| Joel Anthony | C | 566 | 20.1 | 84.4 | 104 | +0.22 | 3.5 | 3.8 |
| Averages | 1625 (19.8mpg) | 17.6 | 44.7 | 62.3 | +0.2 | 8.4 | 9.2 |
| Name | Position | Minutes Played | ATT VPM | DEF VPM | OVRL | WR (+/-) | Possession Per Game Value | Adjusted PPGV (2019/20 pace) |
|---|---|---|---|---|---|---|---|---|
| Klay Thompson | SG | 2506 | 18.4 | 29.9 | 48 | +0.13 | 12.8 | 13.2 |
| Kevin Durant | SF | 2325 | 45.1 | 78.3 | 123 | +0.45 | 31.3 | 32.2 |
| Draymond Green | PF | 2287 | 29.5 | 74.3 | 104 | +0.39 | 19.6 | 20.1 |
| Steph Curry | PG | 1631 | 68.7 | 38.5 | 107 | +0.39 | 44.7 | 46 |
| Andre Iguodala | SF | 1622 | 16.8 | 46.5 | 63 | +0.23 | 8.6 | 8.9 |
| Nick Young | SG | 1393 | 9.3 | 15.9 | 25 | +0.02 | 3.3 | 3.4 |
| Shaun Livingston | PG | 1129 | 22.7 | 25.9 | 49 | +0.17 | 7.3 | 7.5 |
| David West | C | 999 | 38.4 | 99.5 | 138 | +0.39 | 10.7 | 11 |
| Zaza Pachulia | C | 972 | 50.2 | 45.9 | 96 | +0.39 | 14.4 | 14.8 |
| Patrick McCaw | SG | 961 | 3.6 | 31.5 | 35 | +.09 | 1.2 | 1.3 |
| Kevon Looney | C | 910 | 23.7 | 77 | 101 | +0.27 | 6.6 | 6.8 |
| Jordan Bell | C | 809 | 42.7 | 93.9 | 137 | +0.39 | 12.3 | 12.7 |
| Omri Casspi | SF | 740 | 20.1 | 50.3 | 70 | +0.33 | 5.7 | 5.9 |
| Quinn Cook | PG | 740 | 27.7 | 6.7 | 34 | +0.14 | 12.6 | 13 |
| JaVale McGee | C | 615 | 50.8 | 103 | 154 | +0.39 | 9.8 | 10.1 |
| Averages | 1309 (16mpg) | 31.2 | 54.5 | 85.6 | +0.28 | 13.4 | 13.8 |
One thing that stands out first, is squad management. The Lakers and Celtics used a small squad in comparison to their more recent counterparts. Only 8 players were given significant minutes (500 or more) for the Lakers and 9 for the Celtics. This was in the fastest-paced era in modern basketball but players were being asked to play more minutes on average than today.
As we progress to the Warriors, we now have 15 players seeing significant minutes at 16 minutes per game average. This is twelve less minutes than the 79/80 Lakers. However, this seems to have been a key to their success. By using the bench and spreading the minutes more, they were able to push the pace of games more. Remember, the Warriors pace was actually above the league average. Players were not only fresher but were also ready to go when called upon. It was brilliant and effective load management.
On the other hand, the sheer endurance and toughness of the starters of the Lakers and Celtics to play so many minutes at such a high pace and with much more physicality is testament to them as athletes. This is something which often goes unappreciated by today’s fans.
Norm Nixon played the most minutes of anyone (3226). The Lakers had three players with more than 3000 minutes, the Celtics had one, the Bulls had one, and neither Miami nor Golden State had any player log that amount of time.
Most starters logged at least 2000 minutes so using that as the benchmark, Larry Bird has the highest ATT VPM and Kareem had the highest DEF VPM. Kareem also had the highest overall VPM.
Kareem also had the highest plus/minus while Bird had the highest PPGV.
Michael Jordan averaged the most points (30.4).
Norm Nixon averaged the most assists (7.8).
Dennis Rodman dominated the boards, both offensive (5.6) and defensive (9.3).
Magic had the most steals (2.4) and turnovers (4.0).
Kareem was far ahead of everyone else with blocks (3.4).
As for shooting, of the players that averaged more than ten 2pt shots per game, Kareem had the best FG% (60.4).
As for players who took more than two 3pt shots per game, Klay Thompson, was the sharpest of the the shooters (44%).
Conclusion
The NBA has always been a stage for some of the best athletes on the planet with extraordinary skills. Every player and squad we’ve looked at displayed these qualities in their own way.
We’ve witnessed changes in squad management, style of play, roles of positions and rules. These teams and their stars were at the forefront of many of these these changes. They have left their mark on the NBA and will continue to inspire and influence future generations.
GLOSSARY
ATT VPM - is the attacking value per minute of a player or team. It is a combination of positive and negative actions on offense. All data points were weighted to the 2019/20 NBA averages.
DEF VPM - is the defensive value per minute of a player or team. It is a combination of positive and negative actions on defense.
OVRL VPM - is the combination of ATT & DEF VPM.
PLUS ACTIONS PER MINUTE - the number of positive actions a player makes per minute (made shots, rebounds, etc.)
MINUS ACTIONS PER MINUTE - the number of negative actions a player makes per minute (missed shots, fouls, etc.)
PLUS/MINUS - the combined plus actions with minus actions.
POSSESSIONS PER GAME VALUE - this is the combined value of every possession of a game for a player or team.
ADJUSTED PPGV - is the figure when adjusted to the 2019/20 pace.
*the VPM has been multiplied by 100, for aesthetic purposes only.
**all stats weighted against 2019/20 averages.
***all data sourced from basketball-reference.com .